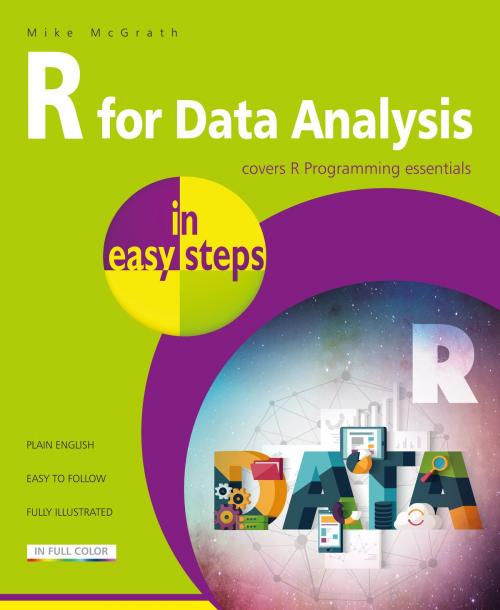
R for Data Analysis in easy steps
R Programming Essentials
Nonfiction, Computers, Programming, Programming Languages| Author: | Mike McGrath | ISBN: | 9781840788150 |
| Publisher: | In Easy Steps Limited | Publication: | February 6, 2018 |
| Imprint: | In Easy Steps | Language: | English |
| Author: | Mike McGrath |
| ISBN: | 9781840788150 |
| Publisher: | In Easy Steps Limited |
| Publication: | February 6, 2018 |
| Imprint: | In Easy Steps |
| Language: | English |
The R language is widely used by statisticians for data analysis, and the popularity of R programming has therefore increased substantially in recent years. The emerging Internet of Things (IoT) gathers increasing amounts of data that can be analyzed to gain useful insights into trends.
R for Data Analysis in easy steps has an easy-to-follow style that will appeal to anyone who wants to produce graphic visualizations to gain insights from gathered data.
R for Data Analysis in easy steps begins by explaining core programming principles of the R programming language, which stores data in “vectors” from which simple graphs can be plotted.
Next, the book describes how to create “matrices” to store and manipulate data from which graphs can be plotted to provide better insights. This book then demonstrates how to create “data frames” from imported data sets, and how to employ the “Grammar of Graphics” to produce advanced visualizations that can best illustrate useful insights from your data.
R for Data Analysis in easy steps contains separate chapters on the major features of the R programming language. There are complete example programs that demonstrate how to create Line graphs, Bar charts, Histograms, Scatter graphs, Box plots, and more. The code for each R script is listed, together with screenshots that illustrate the actual output when that script has been executed. The free, downloadable example R code is provided for clearer understanding.
By the end of this book you will have gained a sound understanding of R programming, and be able to write your own scripts that can be executed to produce graphic visualizations for data analysis. You need have no previous knowledge of any programming language, so it's ideal for the newcomer to computer programming.
Contents:
Getting started
Storing values
Performing operations
Testing conditions
Employing functions
Building matrices
Constructing data frames
Producing quick plots
Telling stories with data
Plotting perfection
