SAS ODS Graphics Designer by Example
A Visual Guide to Creating Graphs Interactively
Nonfiction, Computers, Application Software, Business Software| Author: | Sanjay Matange, Jeanette Bottitta | ISBN: | 9781629605470 |
| Publisher: | SAS Institute | Publication: | December 15, 2016 |
| Imprint: | SAS Institute | Language: | English |
| Author: | Sanjay Matange, Jeanette Bottitta |
| ISBN: | 9781629605470 |
| Publisher: | SAS Institute |
| Publication: | December 15, 2016 |
| Imprint: | SAS Institute |
| Language: | English |
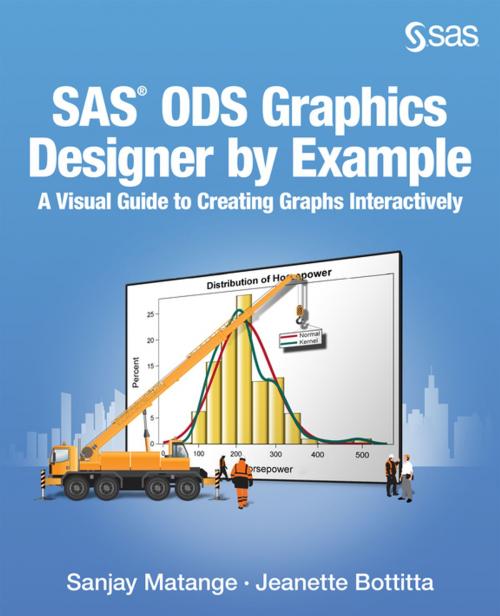
You just got the results from your study, and need to get some quick graphical views of your data before you begin the analysis. Do you need a crash course in the SG procedures (also known as ODS Graphics procedures) just to get a simple histogram? What should you do? The ODS Graphics Designer is the answer. With this application, you can use the interactive drag-and-drop feature to create many graphs, including histograms, box plots, scatter plot matrices, classification panels, and more. You can render your graph in batch with new data and output the results to any open ODS destination, or view the generated Graph Template Language (GTL) code as a leg-up to GTL programming. You can do all this with ease! SAS(R) ODS Graphics Designer by Example: A Visual Guide to Creating Graphs Interactively describes in detail the features of the ODS Graphics Designer. The designer application lets you, the analyst, create graphs interactively so that you can focus on the analysis, and not on learning graph syntax. This book will take you step-by-step through the features of the designer, providing you with examples of graphs that are commonly used for the analysis of data in the health care, life sciences, and finance industries. The examples in this book will help you create just the right graph with ease!
You just got the results from your study, and need to get some quick graphical views of your data before you begin the analysis. Do you need a crash course in the SG procedures (also known as ODS Graphics procedures) just to get a simple histogram? What should you do? The ODS Graphics Designer is the answer. With this application, you can use the interactive drag-and-drop feature to create many graphs, including histograms, box plots, scatter plot matrices, classification panels, and more. You can render your graph in batch with new data and output the results to any open ODS destination, or view the generated Graph Template Language (GTL) code as a leg-up to GTL programming. You can do all this with ease! SAS(R) ODS Graphics Designer by Example: A Visual Guide to Creating Graphs Interactively describes in detail the features of the ODS Graphics Designer. The designer application lets you, the analyst, create graphs interactively so that you can focus on the analysis, and not on learning graph syntax. This book will take you step-by-step through the features of the designer, providing you with examples of graphs that are commonly used for the analysis of data in the health care, life sciences, and finance industries. The examples in this book will help you create just the right graph with ease!


